READING AN AUDIOGRAM


What is an Audiogram?
Results from a hearing test are displayed on an audiogram. Initially, it might look like a bunch of indecipherable lines and symbols. But once you learn how to read and interpret an audiogram, you’ll better understand your child’s hearing loss.
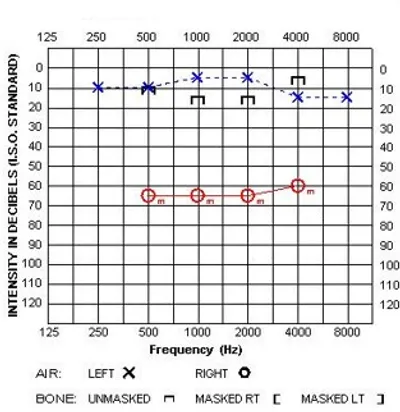
Think of an audiogram as a graph or picture of your child’s hearing. The audiogram shows how loud sounds have to be for your child to hear at each frequency (pitch) in each ear.
Put another way, your audiologist is measuring the softest sound your child can hear. The softest level at which your child can hear a sound is called the threshold.
How to Read an Audiogram?
Hearing tests measure the frequency (pitch) and intensity (loudness) of sounds your child can hear to determine their degree of hearing loss.
Frequency measures how high or low a sound is. The higher that number (frequency), the higher is the pitch of the sound. Frequency is measured in Hertz (Hz). Examples of “low-frequency” sounds are a rumble of thunder, a tuba, and sounds like “oo”. Examples of “high-frequency” sounds are a bird chirping, a whistle, and the “s” sound.
Intensity, or loudness of the sound is measured in decibels (Db). Examples of Low-decibel (soft) sounds include a clock ticking, a person whispering, and leaves rustling. Examples of high-decibel (loud) sounds are a lawnmower, a car horn, and a rock concert.
The audiogram is a fairly simple graph:
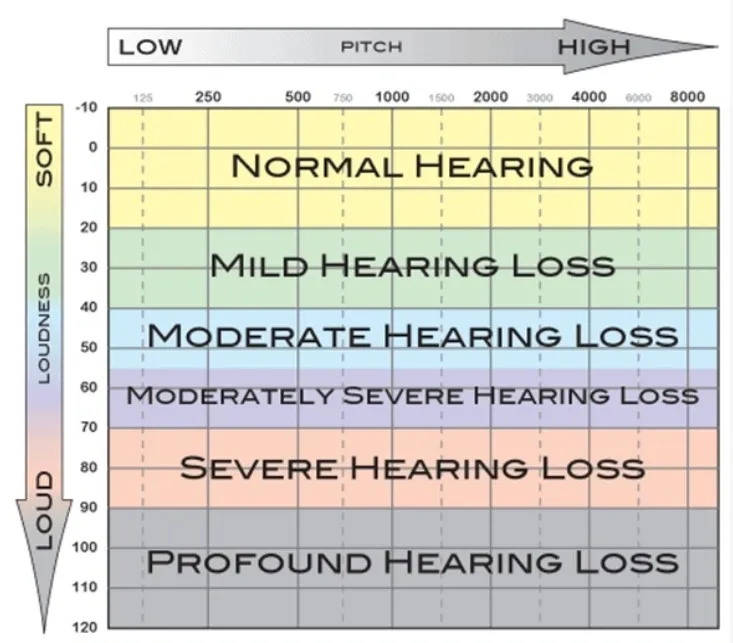
The horizontal axis (X-axis) measures the frequency, or the pitch of the sound from lowest to highest (left to right). The numbers run from 125 to 8,000 and measure hertz (Hz). You can think of the frequency axis like the keys on a piano where the sounds become higher pitched as you progress from left to right. Most speech falls into the 250 to 6000 Hz range.
The vertical axis (Y-axis) measures the intensity, or loudness, of the sound. It is measured in decibels (Db) and ranges from -10 to 110 on the audiogram. It is measured vertically from top to bottom, with low-decibel (soft) sounds appearing at the top of the graph and high-decibel (loud) sounds at the bottom. As the number gets bigger, so does your child’s hearing loss (i.e. the loudness of the softest sound your child can hear).

What do the symbols on an audiogram mean?
There are several different symbols used to indicate thresholds on an audiogram, depending on the specific tests performed.
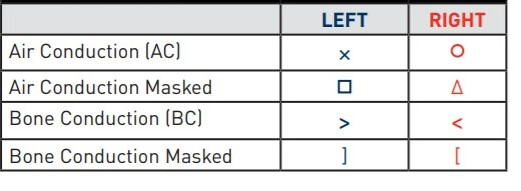
Testing with headphones or ear buds is called air conduction testing because the sound must travel through the air of the ear canal to reach the inner ear. The air conduction results for the right ear are marked with a red “O,” and the results for the left ear are marked with a blue “X.”
Masked air conduction testing is marked with a triangle or square.
Bone conduction testing, in which a device is placed behind the ear in order to transmit sound through the vibration of the mastoid bone, is marked with a “<” or “>” symbol. Masked bone conduction testing is marked with a “[“ or “]”.
Masking means that some “white noise” is played in the opposite ear while testing an ear. The reason to do this is to prevent sound from the side being tested from going over to the other side.
Each symbol on the chart represents your child’s threshold for a given frequency.
What are the Degrees of Hearing Loss?
- Normal hearing: up to 20 dB
- Mild hearing loss: 20 to 40 dB
- Moderate hearing loss: 40 to 55 dB
- Moderately severe hearing loss: 55 to 70 dB
- Severe hearing loss: 70 to 90 dB
- Profound loss: 90 dB or more


